
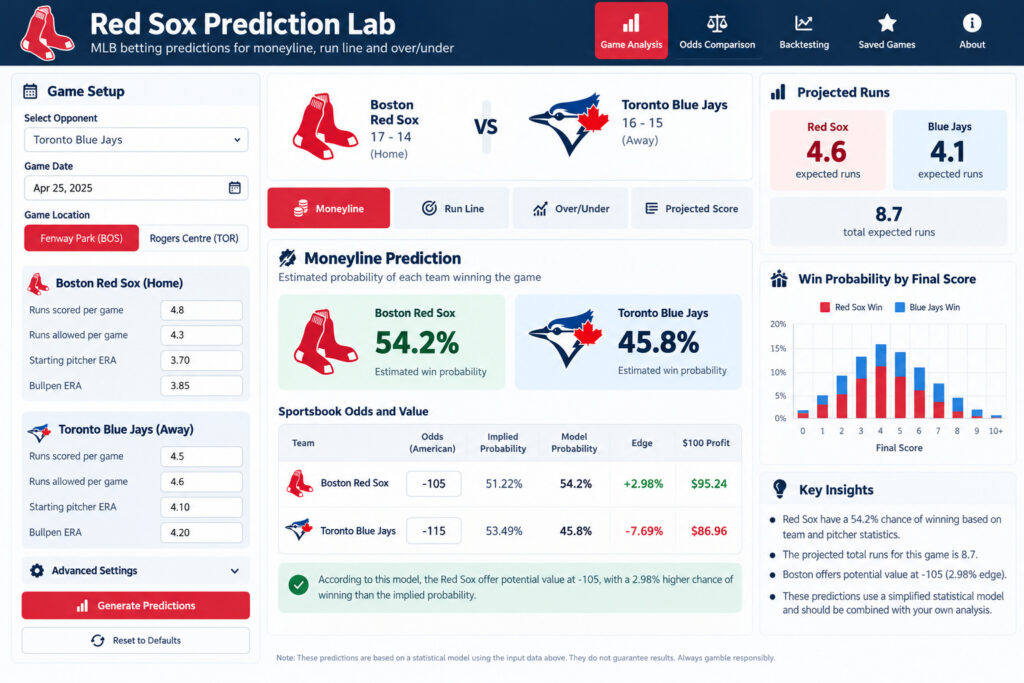
Baseball fans spend plenty of time debating starting pitchers, bullpen fatigue, injuries and whether the Red Sox can put enough runs on the board to beat their next opponent. But what if you could turn those discussions into a prediction app that calculates probabilities for three of the most popular MLB betting markets?
With ChatGPT, publicly available baseball statistics and a simple statistical model, you can build a dashboard that estimates the probability of the Boston Red Sox winning a game, covering a 1.5-run spread or finishing above or below a sportsbook’s projected total.
You don’t need to be a professional programmer. ChatGPT can help create the interface, write the calculations and explain how the different parts work.
For this tutorial, we’ll build a fictional Red Sox versus Toronto Blue Jays matchup. Canadian baseball fans can follow exactly the same process, and all betting examples will use American odds and US dollars.
The objective isn’t to build a machine that guarantees winning bets. It’s to create a transparent tool that helps you understand what the statistics suggest and whether a sportsbook’s price differs from your model’s estimate.
Step 1: Decide What Your MLB Prediction App Should Do
Before asking ChatGPT to write code, define the app’s basic functions.
We’ll call ours Red Sox Prediction Lab.
The dashboard should let users select the Red Sox and an opposing MLB team, enter relevant statistics, and switch between three prediction markets.
Moneyline: Estimate the probability that Boston or its opponent wins the game.
Run line: Estimate the probability that Boston wins by at least two runs or that its opponent stays within 1.5 runs.
Over/under: Estimate the probability that the teams score more or fewer runs than a selected sportsbook total.
The app should also accept sportsbook odds, calculate implied probabilities and display the estimated value of each selection.
Open ChatGPT and enter the following prompt:
“Create a responsive baseball prediction dashboard called Red Sox Prediction Lab. The app should focus on Boston Red Sox games and allow users to select any MLB opponent. Include three tabs: Moneyline, Run Line and Over/Under.
Add sections for team statistics, starting pitcher information, ballpark factors and sportsbook odds. Display the estimated probability for each betting outcome, the bookmaker’s implied probability and the difference between them.
Use a clean sports analytics design with navy blue, red and white colours. Do not invent live statistics or betting odds. Start with clearly labelled demonstration data and make all calculations transparent.”
ChatGPT can generate an initial interface using React, HTML and JavaScript. If you’re using an environment that supports app previews, you can inspect the layout and request changes before adding the statistical calculations.
At this stage, the dashboard is only a visual framework. The next steps will give it meaningful inputs.
Step 2: Collect the Baseball Statistics That Matter
A useful prediction app needs more than a team’s win-loss record.
For each matchup, gather recent and season-long statistics from sources such as MLB’s official statistics pages, Baseball Savant and FanGraphs.
Start with runs scored and allowed per game, team offensive performance, starting pitcher ERA and FIP, bullpen performance, and the location of the game.
You should also consider whether a team’s recent performance differs significantly from its season average. However, a five-game winning streak should not automatically outweigh several months of data.
For a Red Sox–Blue Jays matchup, your input table might look like this:
Statistic:
Runs scored per game
Boston: 4.8
Toronto: 4.5
Runs allowed per game
Boston: 4.3
Totonro: 4.6
Starting pitcher ERA
Boston: 3.70
Toronto: 4.10
Bullpen ERA
Boston: 3.85
Toronto: 4.20
Home team
Boston: Yes
Tornot: No
These are invented demonstration figures, not current team statistics.
Ask ChatGPT:
“Create an editable input form for the Red Sox Prediction Lab using the team statistics in this table. Include fields for runs scored per game, runs allowed per game, starting pitcher ERA, bullpen ERA and home-field advantage.
Validate the inputs and identify any missing values. Allow users to update the figures before generating a prediction. Explain which inputs are used in each calculation.”
For an initial version, manually entering statistics is perfectly acceptable.
You can later connect the application to a licensed sports data provider or a documented public data source. ChatGPT should not be treated as a reliable source of live scores, starting lineups or current sportsbook prices unless those details are actually retrieved and verified.
Step 3: Build a Model That Estimates Runs
The three betting markets are related, so they should not use completely separate, arbitrary predictions.
A practical starting point is to estimate how many runs each team is expected to score, then use those estimates to model possible final scores.
For a beginner’s prototype, we can use a simplified Poisson model. This assumes each team’s run total follows a Poisson distribution with its own expected scoring rate.
Real baseball scoring is more complicated. Runs are not always independent, and the model may underestimate unusually high-scoring games. Still, it provides a transparent foundation that can be improved and tested.
Ask ChatGPT:
“Add a baseball run prediction model to the application.
Calculate an expected runs value for each team using a documented combination of offensive production, opposing pitching, bullpen performance and home-field adjustment.
For the prototype, use a Poisson distribution to calculate the probability of different final scores. Explain the weighting of every input and make the weights editable.
Use the resulting score probabilities consistently for moneyline, run line and over/under predictions. Do not generate unrelated probability estimates for each market.”
This instruction is important because all three markets depend on the same possible game outcomes.
If your model predicts that Boston is more likely to win, it should calculate that conclusion from the same underlying scoring distribution used to estimate the run line and total.
The initial expected-runs formula is a modelling assumption, not a proven predictive system. Its weights will need historical testing.
Step 4: Create the Moneyline Prediction
Moneyline betting is the simplest market to model because you’re predicting which team will win.
Suppose the app’s hypothetical model estimates:
Boston Red Sox: 54% win probability.
Toronto Blue Jays: 46% win probability.
These percentages should come from the model’s projected score distribution, not from ChatGPT’s opinion about which team is stronger.
Because MLB games cannot finish tied, the model must account for extra innings. A simple prototype can allocate tied regulation-score outcomes using an explicitly stated extra-innings assumption. A more advanced model can simulate extra innings separately.
Now imagine a sportsbook offers Boston at American odds of −105.
Those odds imply a break-even probability of approximately 51.22%.
If the model estimates Boston’s chance of winning at 54%, the difference is about 2.78 percentage points.
That difference represents a potential model-estimated edge, not guaranteed profit.
To add this feature, use the prompt:
“Build a Moneyline tab that calculates each team’s win probability from the projected game-score distribution.
Include an American odds input for both teams. Convert those odds into implied probabilities, calculate the model’s estimated edge and show the potential profit from a successful $100 wager.
Account explicitly for extra innings so the two win probabilities total 100%. Display a warning that a positive estimated edge may reflect model error.”
For Canadian bettors following Toronto games, the same mathematics applies. Sportsbook availability and odds formats may differ depending on the province, but the underlying probability calculation does not change.
Step 5: Add the Run Line Prediction
Baseball run line bets typically use a 1.5-run spread.
A Red Sox −1.5 selection requires Boston to win by at least two runs.
A Blue Jays +1.5 selection wins if Toronto wins outright or loses by exactly one run.
This market requires more information than the moneyline because the margin of victory matters.
For example, suppose the app estimates the following hypothetical probabilities:
Boston wins by two or more runs: 34%.
Toronto wins or loses by one run: 66%.
These outcomes are complementary for a Boston −1.5 and Toronto +1.5 comparison, assuming standard settlement rules.
The app should calculate these probabilities by adding together the relevant outcomes from the projected final-score distribution.
Ask ChatGPT:
“Add a Run Line tab to Red Sox Prediction Lab.
Use the existing projected final-score distribution to calculate the probability of Boston covering −1.5 runs and its opponent covering +1.5 runs.
Allow users to reverse the teams and enter the sportsbook’s American odds for each selection.
Display the probability, implied probability, estimated edge and hypothetical profit from a winning $100 bet. Ensure run line probabilities remain consistent with the moneyline model.”
One useful addition is a chart showing the model’s projected margin of victory.
That allows readers to see whether the model expects a close game or gives one team a meaningful chance of winning comfortably.
Step 6: Build the Over/Under Runs Predictor
The over/under market focuses on the combined number of runs scored.
If a sportsbook sets the total at 8.5 runs, an over bet wins when the teams score nine or more. An under bet wins when they score eight or fewer.
Suppose the model projects 4.6 runs for Boston and 4.1 for Toronto.
The combined expected total would be 8.7 runs.
However, a projection of 8.7 runs does not automatically mean the over 8.5 has a greater than 50% chance of winning.
The app must calculate the probability of each possible total using its scoring distribution.
This is where the statistical model becomes particularly useful.
Ask ChatGPT:
“Create an Over/Under tab using the expected runs and projected score distribution already calculated by the app.
Allow users to enter a sportsbook total such as 7.5, 8.5 or 9.5.
Calculate the probability of finishing over and under that total. Display the expected combined runs, each outcome’s probability and the implied probability from the available sportsbook odds.
For whole-number totals, handle pushes separately and explain how they affect the probability and expected-value calculation. Do not treat the projected average runs as the probability of an over.”
The finished tab should show the expected runs alongside the full probability calculation.
This helps prevent one of the most common mistakes in baseball betting analysis: confusing an average projection with the likelihood of beating a specific line.
Step 7: Compare the Model With Sportsbook Odds
Once all three markets work, the next feature is an odds comparison panel.
A model prediction is only one part of a betting decision. The price offered by the sportsbook also matters.
Consider two hypothetical sportsbooks offering the same Boston moneyline:
Sportsbook A:
Boston moneyline: −105
Profit on a winning $100 bet: $95.24
Sportsbook B
Boston moneyline: −120
Profit on a winning $100 bet: $83.33
Both bets win or lose on the same result, but the potential payouts differ.
If the model estimates Boston’s win probability at 54%, the −105 price offers a small positive expected value under that assumption, while the −120 price offers negative expected value.
The difference is why price comparison matters.
Ask ChatGPT:
“Add an Odds Comparison section to the app. Allow users to enter prices from at least three sportsbooks for the same moneyline, run line or over/under selection.
Convert all American odds into decimal odds internally, calculate implied probability and expected value, and rank the available prices.
Show the potential profit on a winning $100 wager. Highlight the best available price, but label a selection as model-estimated positive value only when its calculated expected value is greater than zero.
Include an optional field for the time each price was recorded.”
For a broader explanation of sportsbook selection and how betting platforms differ, readers can consult GambleOnline.ca’s sportsbook coverage, which includes information relevant to Canadian bettors comparing online betting options.
The app should never assume that every sportsbook accepts customers from every location.
Step 8: Test the App Against Historical Red Sox Games
A polished dashboard is not evidence that its predictions work.
Before trusting the model, test it against historical games that were not used to select its parameters.
A useful starting experiment would involve a completed Red Sox season.
For each game, record the statistics that were available before the first pitch, the model’s prediction and the final result.
If historical closing odds are available, you can also compare the model’s estimated probabilities with actual sportsbook prices.
Ask ChatGPT:
“Create a Backtesting tab for Red Sox Prediction Lab.
Allow users to upload a CSV containing historical MLB games, pregame team statistics, starting pitcher data, available betting odds and final scores.
Generate predictions using only information that would have been known before each game.
Evaluate moneyline accuracy, probability calibration, Brier score and hypothetical betting ROI. Report results separately for moneyline, run line and over/under markets.
Use a chronological training and testing split. Prevent future game results or end-of-season statistics from leaking into earlier predictions. Include subscription costs or transaction costs when relevant.”
Backtesting is where the project moves from a demonstration into a genuine analytical experiment.
A model that correctly predicts 55% of games is not necessarily profitable. The results depend on the odds, the types of selections made and whether the model’s probability estimates are properly calibrated.
Likewise, a short period of profitable hypothetical betting does not establish that the system has a sustainable advantage.
Step 9: Improve the App Without Making It Unnecessarily Complicated
Once the basic version works, you can add more advanced features.
One improvement is to distinguish starting pitcher performance from bullpen performance more carefully. Another is to account for park factors, since Fenway Park and Toronto’s Rogers Centre have different playing characteristics.
You could also incorporate confirmed lineups, rest days, weather conditions and recent bullpen usage.
But additional variables do not automatically produce better predictions.
Every improvement should be tested against historical data to see whether it improves out-of-sample performance.
Ask ChatGPT:
“Review the Red Sox Prediction Lab model for weaknesses. Identify assumptions that may be unrealistic, including independent Poisson scoring, pitcher weighting, home-field advantage and bullpen performance.
Recommend improvements one at a time. For each improvement, explain what additional data is required and how to test whether it improves predictions on unseen games.
Do not claim improved accuracy without backtesting evidence.”
This final prompt is useful because it asks ChatGPT to act as a model reviewer rather than simply generate more features.
What the Finished Red Sox Prediction App Should Look Like
The completed dashboard should have a straightforward workflow.
The reader selects a matchup, checks the available statistics and enters the latest sportsbook odds.
The app then calculates projected runs and displays three separate market tabs.
The moneyline tab shows each team’s estimated chance of winning.
The run line tab shows the probability of covering a 1.5-run spread.
The over/under tab shows the estimated probability of the combined score finishing above or below the selected total.
Each tab includes implied sportsbook probability, estimated edge and a hypothetical $100 payout.
A separate backtesting section allows users to review how the model performed against historical games.
Most importantly, every prediction should be traceable to the data and assumptions used to produce it.
Can ChatGPT Really Predict Red Sox Games?
ChatGPT can help build the interface, explain statistical concepts, write code and identify errors in the model.
What it cannot do is guarantee that the Red Sox will win, accurately predict a final score without reliable data, or prove that a betting strategy is profitable simply because its calculations look convincing.
A model is only as useful as its inputs, assumptions and historical testing.
For Red Sox fans, the real benefit of building an MLB prediction app is having a structured way to examine matchups instead of relying entirely on intuition.
And for Canadian baseball fans following the Blue Jays, the same tool offers a way to compare their team’s chances against Boston and the rest of the league.
Whether the next matchup is at Fenway Park or Rogers Centre, the goal remains the same: turn baseball statistics into understandable probabilities, compare those estimates with sportsbook prices and recognise the uncertainty behind every prediction.
About the Author
GambleOnline.ca is an independent online gambling media website founded in 2008, publishing experience-based reviews, guides and analysis of online casinos, sportsbooks and poker platforms. Its editorial team conducts hands-on testing and research to provide factual, player-focused insights, alongside educational content on gambling strategy, legality and responsible play.